Product Analytics
with an edge
Event Analytics for Product, Marketing, and Data teams that makes it fast to get answers, make decisions, and see impact on users and revenue

Mixpanel
Mixpanel’s vision is universal access to insightful answers. Our event-based data model, capturing interactions, provides a dynamic perspective on product, company, and behavioural insights for informed decision-making.
All the answers, at your fingertips
Insights
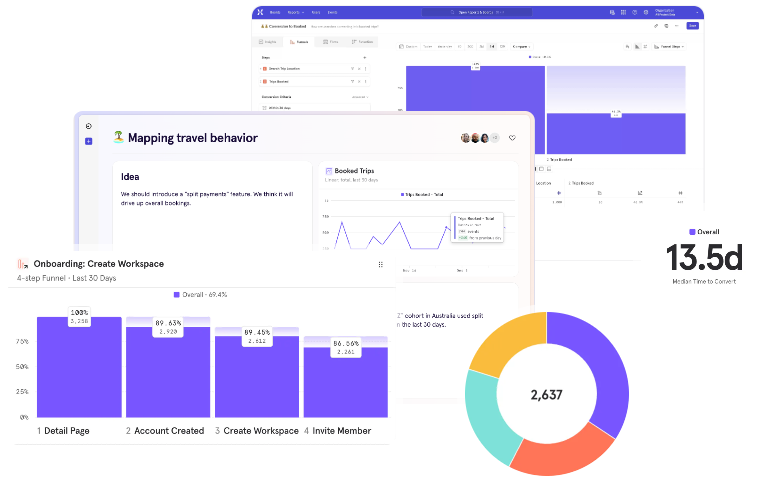
Visualize trends and data points quickly
Flows
Find common user paths
Funnels
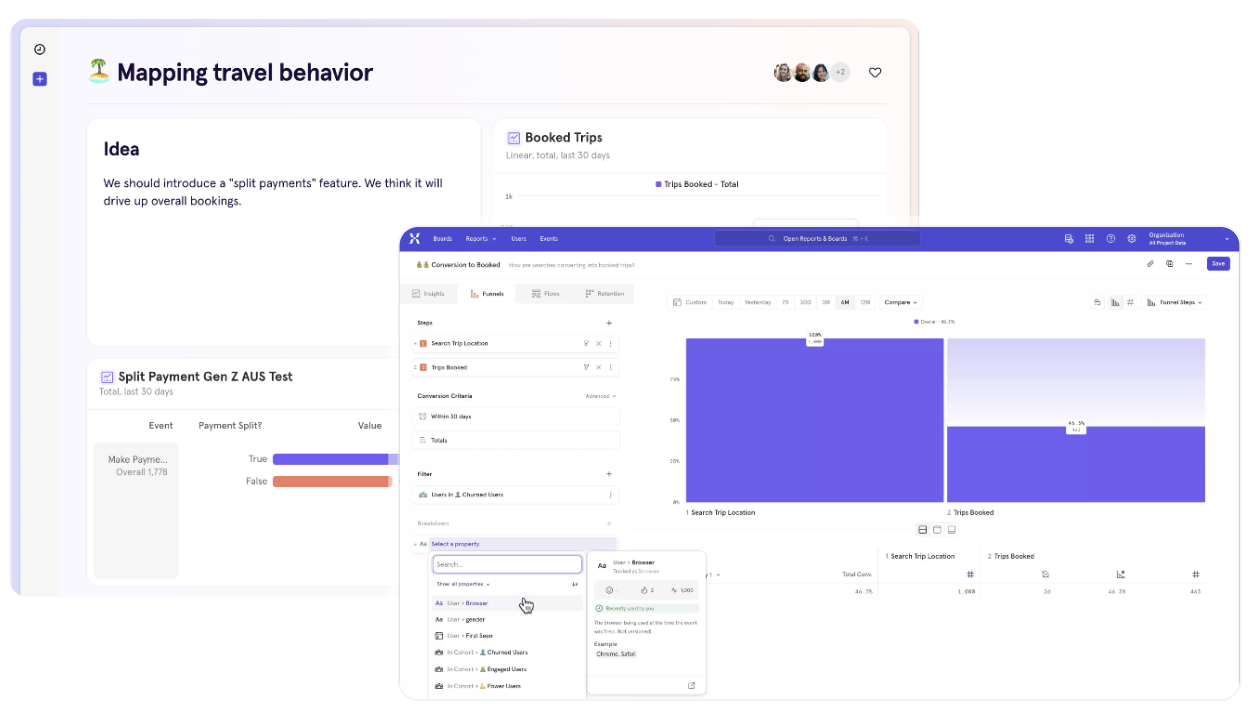
See who converts, and why
Retention
Learn what drives stickiness
Experiment
Analyse if an A/B test causes positive change
Impact
Understand how new features impact metrics
Cohorts
Segment users for highly targeted analyses
Signal
Quantify the correlation between events
A foundation for deep data insights
Save time
Easily build sophisticated reports in seconds instead of hours or days in SQL.
Priortise
Instantly pull up the insights you need to plan your roadmap or strategy with confidence.
Measure impact
Test your assumptions — and learn if your launches, campaigns, or experiments deliver results.
Trust your data
Create a source of truth and keep data clean and usable with a warehouse connector, data dictionary, and governance settings.
Connect all data
Leverage existing and additional business data sources to answer any specific behavioral question.
Unblock your team
Intuitive UI to ask questions and get answers effortlessly. Perform complex behavioral analysis without SQL, R, or Python.
Know your customer
Drill into data and surface hidden trends with funnels, advanced segmentation, and retention analysis.
Get aligned
Share insights with the team via Slack, alerts, annotations, or Boards to make decisions on where to focus resources and time.
Business Impact
298%
ROI, increased revenue by improving customer LTV
$465K+
Productivity Savings withs self-service capabilities (faster funnel, retention, segmentation analysis)
$1.1M+
A minimum cost of alternative approach: creating and maintaining an in-house analytics solution
On average, Mixpanel customers experience
Increase the efficiency of your Customer Data
+31%
Improvement in conversion rates
+32%
Improvement in user engagement
+30%
Unblock truth for everyone
Need som text here


Book a meeting to get started
Hop on a quick 20 min call with one of our experts to find out what HEMOdata can do for you.
